|
|

N.V. Pushkov
|

23/07/2026 03:22 MSK
|
|
 |
| |
|
|
| |
The experimental base of the investigations is the topside sounding data obtained on board of the Intercosmos-19 and Cosmos-1809 satellites. The Intercosmos-19 satellite was active during the high solar activity period from March 1979 to February 1981. It carried on board the following scientific payload: satellite ionospheric station for radio sounding of ionosphere (IS-338) and apparatus for the measurements of low-frequency electromagnetic field (VLF-2ME), electric component of high-frequency field (AHF-2K), electron temperature (KM-3), and spectrometer of photoelectrons (SF3-M). The Intercosmos-19 characteristics are given in the Table.
| Parameter |
Интеркосмос-19 |
Космос-1809 |
| Period of active processing |
from February, 1979 till February, 1981 |
from February, 1986 till December, 1990 |
| Orbit Heights |
500-1000 km |
~1000 km |
| Orbit Inclination |
74° |
80° |
| Period between sounding |
8 s, 16 s, 32 s, 64 s |
16 s, 32 s |
| Duration of one telemetric data record |
~15 m, 1 h, 2 h, 17 h |
1 h, 2 h |
The Cosmos-1809 satellite was launched on December 18, 1986 and failed on May 23, 1993. The scientific apparatus consisted of topside radiosound (IS-338) and set of the instruments for the measurements of the local parameters of the space plasma: low-frequency electromagnetic field (VLF-2ME), quasistationary electric field (DCEF), electric component of high-frequency field (AHF-2K), electron density and its irregularities (inhomogeneities) (IZ-2), electron temperature (KM-9), mass-spectrometer (NAM-4) and spectrometer of photoelectrons (SF-EM).
The N(h)-profiles of the electron density in the topside ionosphere were calculated from the ionograms obtained by means of IS-338. The example of such ionogram obtained on board of the Intercosmos-19 on November 28, 1979 is shown in Figure 1.
Figure 1. Ionogram obtained from topside sounding onboard Intercosmos-19
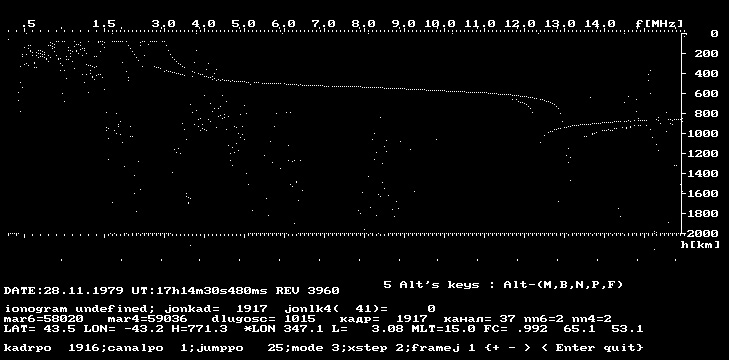
Figure 2. N(h)-profile of the mid-latitude ionosphere

The N(h)-profile of the topside ionosphere calculated from this ionogram is shown in Figure 2. It is a typical profile for the daytime mid-latitude ionosphere for high solar activity.
|
|
|
|
|


